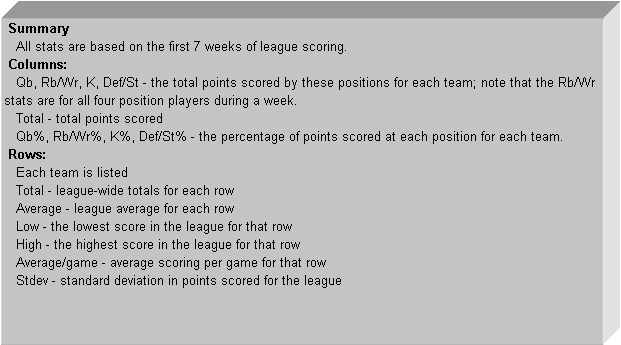
| Team | Qb | Rb/Wr | K | Def/St | Total | Qb% | Rb/Wr% | K % | Def/St% | |
| Golem | 42 | 212 | 43 | 92 | 389 | 11% | 54% | 11% | 24% | |
| Sun Valley | 64 | 217 | 50 | 53 | 384 | 17% | 57% | 13% | 14% | |
| Coochey | 60 | 186 | 36 | 53 | 335 | 18% | 56% | 11% | 16% | |
| Baghdad | 73 | 167 | 53 | 73 | 366 | 20% | 46% | 14% | 20% | |
| Cronie | 66 | 185 | 48 | 44 | 343 | 19% | 54% | 14% | 13% | |
| Puffin | 59 | 164 | 66 | 40 | 329 | 18% | 50% | 20% | 12% | |
| Grayout | 9 | 119 | 39 | 85 | 252 | 4% | 47% | 15% | 34% | |
| Elk Grove | 33 | 183 | 22 | 48 | 286 | 12% | 64% | 8% | 17% | |
| white sharks | 43 | 102 | 49 | 89 | 283 | 15% | 36% | 17% | 31% | |
| Osoyoos | 53 | 118 | 36 | 45 | 252 | 21% | 47% | 14% | 18% | |
| Total | 502 | 1653 | 442 | 622 | 3219 | 16% | 51% | 14% | 19% | |
| Average | 50.2 | 165.3 | 44.2 | 62.2 | 321.9 | 15% | 51% | 14% | 20% | |
| Low | 9 | 102 | 22 | 40 | 252 | 4% | 36% | 8% | 12% | |
| High | 73 | 217 | 66 | 92 | 389 | 21% | 64% | 20% | 34% | |
| Average/game | 7.2 | 23.6 | 6.3 | 8.9 | 46.0 | |||||
| 5.9 | ||||||||||
| Stdev | 51.1 | |||||||||

|
||||||||||